Creates a theoretical variogram for a separable first order autoregressive (AR1) process.
Usage
theoretical_variogram(
  ncols = 10,
  nrows = 20,
  var = 1,
  col.cor = 0.5,
  row.cor = 0.7,
  prop.spatial = 1
)
Arguments
- ncols
A scalar defining the number of columns.
- nrows
A scalar defining the number of rows.
- var
A scalar defining the variance of the variogram.
- col.cor
A scalar defining the column autocorrelation,
- row.cor
A scalar defining the row autocorrelation.
- prop.spatial
A scalar defining the proportion of spatial trend.
Value
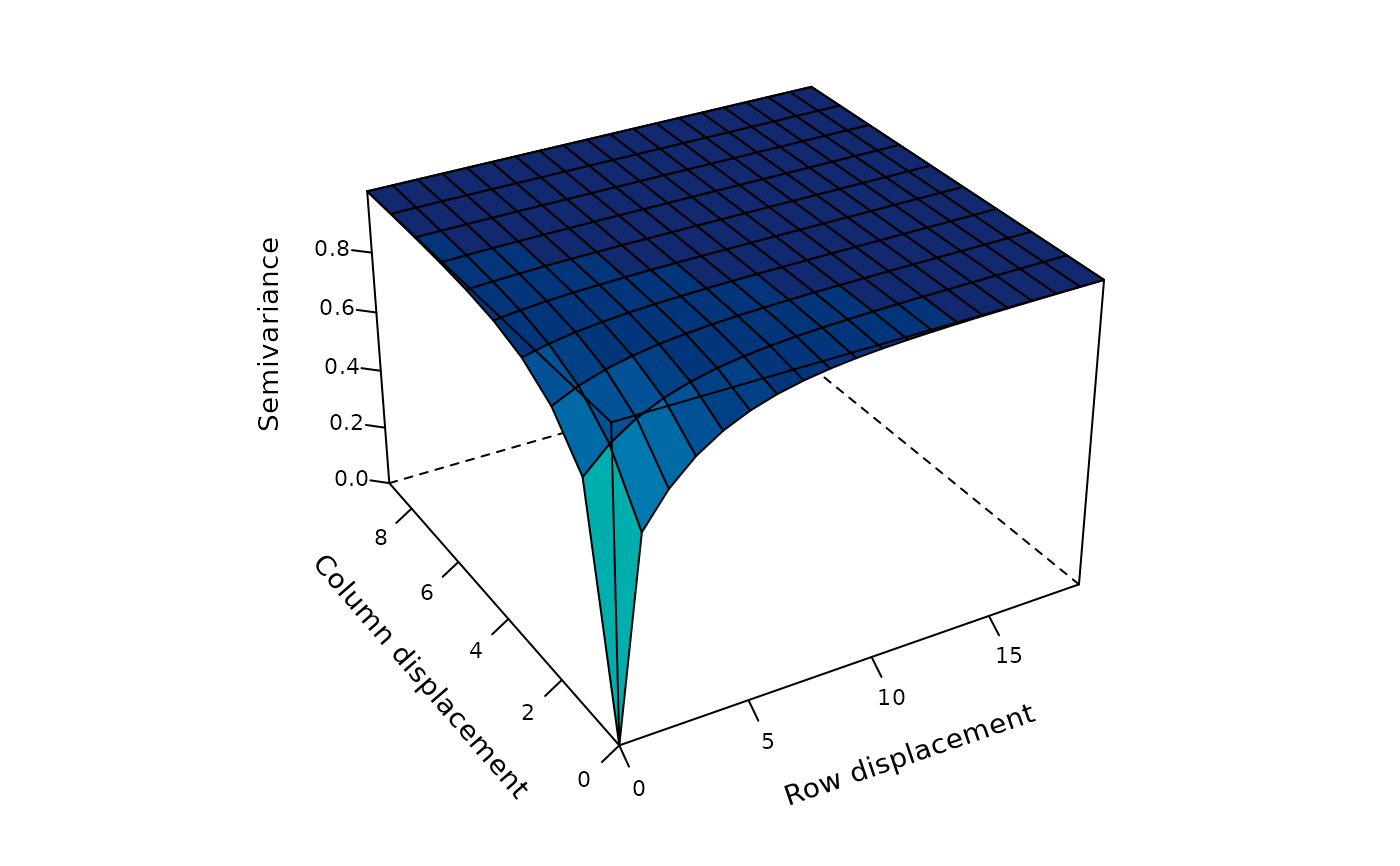
A theoretical variogram with x- and y-axes displaying the row and column displacements, and the z-axis displaying the semivariances (variogram ordinates) for a separable autoregressive process.
Examples
# Theoretical variogram for a field trial with 10 columns and 20 rows, based
# on column and row autocorrelations of 0.5 and 0.7, and a proportion of
# spatial trend of 0.5. The remaining proportion represents random error.

variogram <- theoretical_variogram(
  ncols = 10,
  nrows = 20,
  var = 1,
  col.cor = 0.5,
  row.cor = 0.7,
  prop.spatial = 0.5
)

# Theoretical variogram
variogram


# Extract the data frame with the column and row displacements, and the
# theoretical semivariances.
variogram_df <- variogram$data
# Extract the data frame with the column and row displacements, and the
# theoretical semivariances.
variogram_df <- variogram$data