Creates a sample variogram for a set of effects (e.g., plot errors).
Arguments
- df
A data frame with columns containing the column and row dimensions, and the effects to be plotted.
- effect
The name of the effects to be plotted.
- min.pairs
Minimum number of pairs for which semivariances are displayed (default is 30).
- dim.names
An optional vector defining the column and row dimensions ('col' and 'row' by default).
Value
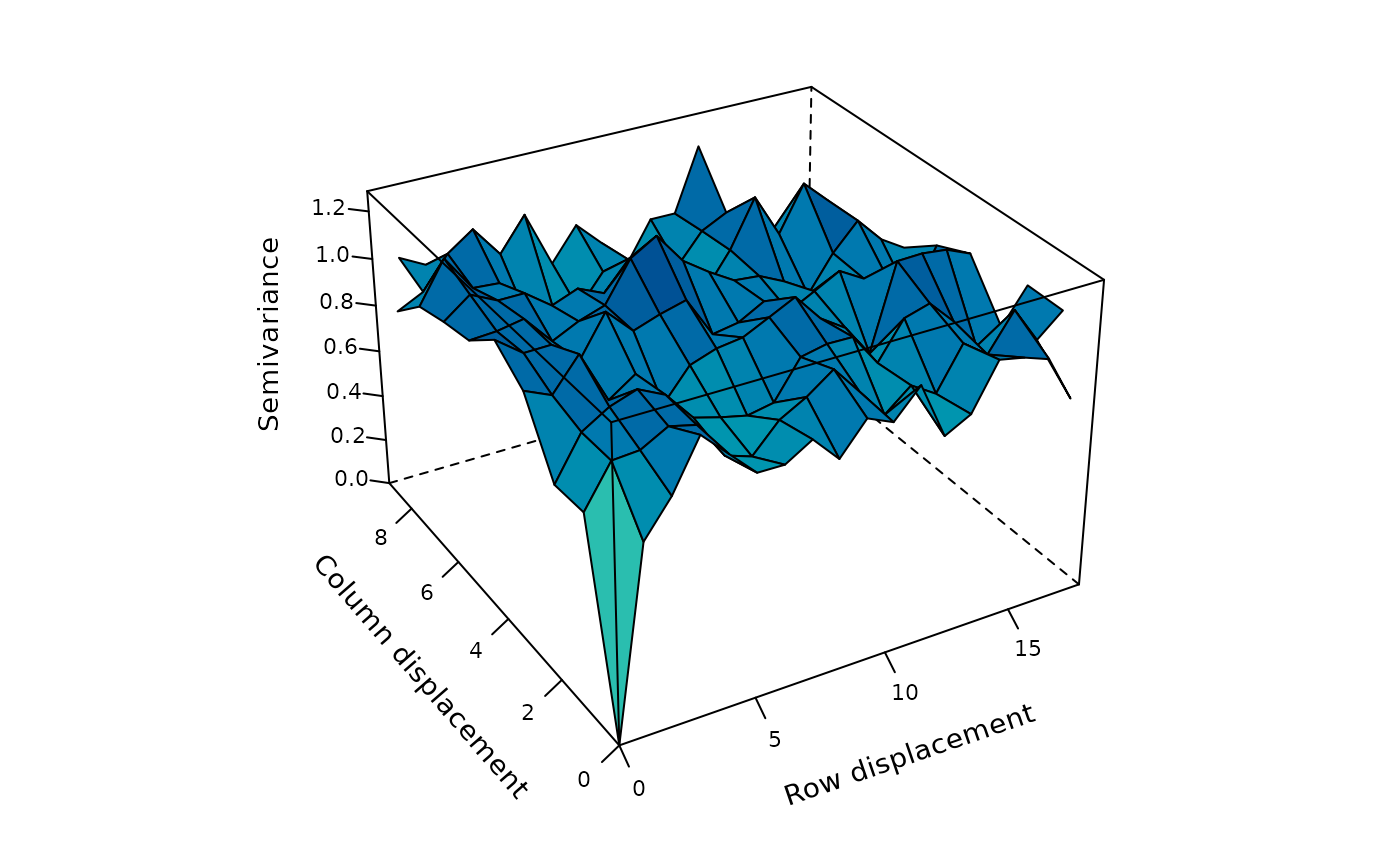
A sample variogram with x- and y-axes displaying the row and column displacements, and the z-axis displaying the average semivariances (variogram ordinates) for the effects.
Examples
# Sample variogram of plot errors simulated using a separable first order
# autoregressive (AR1) process.

error_df <- field_trial_error(
  ntraits = 1,
  nenvs = 1,
  spatial.model = "AR1"
)

variogram <- sample_variogram(
  df = error_df,
  effect = "e.Trait1"
)

# Sample variogram
variogram


# Extract the data frame with the column and row displacements, and the
# average semivariances.
variogram_df <- variogram$data
# Extract the data frame with the column and row displacements, and the
# average semivariances.
variogram_df <- variogram$data