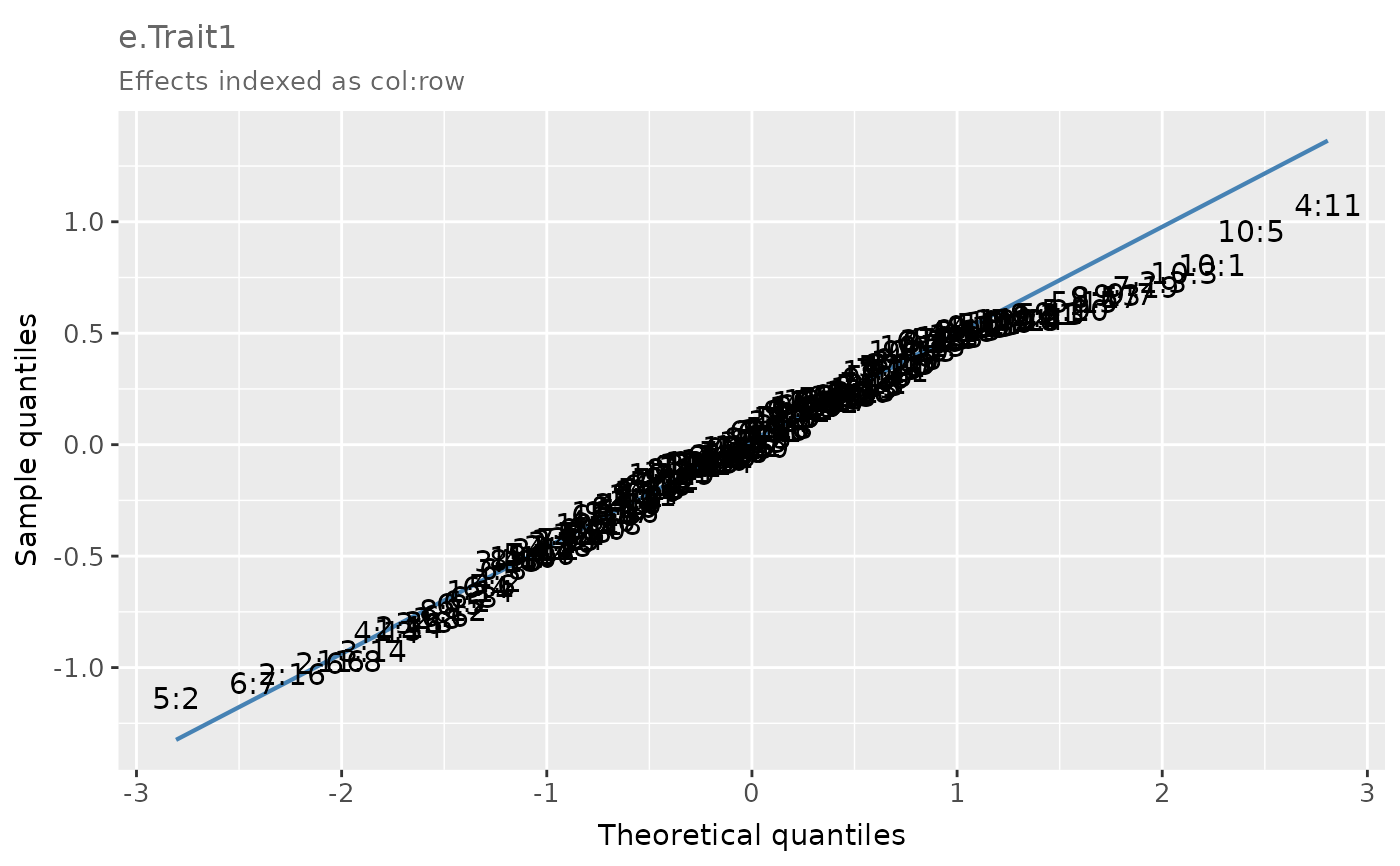
Creates a normal quantile-quantile (Q-Q) plot for a set of effects (e.g., phenotypes, genetic values, or plot errors).
Arguments
- df
A data frame or vector with the effects to be plotted.
- effect
A character defining the effects to be plotted. Ignored when 'df' is a vector.
- labels
When
TRUE(default isFALSE), column and row labels are displayed. This requires additional columns in the data frame, as specified bydim.names.- dim.names
An optional vector defining the column and row dimensions ('col' and 'row' by default).
Value
A Q-Q plot with x- and y-axes displaying the theoretical and sample quantiles of the effects, respectively.
Examples
# Q-Q plot of the simulated plot errors in the example data frame 'error_df_bivar'
# for Trait 1 in Environment 1.

error_df <- error_df_bivar[error_df_bivar$env == 1, ]

qq <- qq_plot(
  df = error_df,
  effect = "e.Trait1",
  labels = TRUE
)

# Q-Q plot
qq


# Extract the data frame with the theoretical and sample quantiles of the
# user-defined effects.
qq_df <- qq$data
# Extract the data frame with the theoretical and sample quantiles of the
# user-defined effects.
qq_df <- qq$data