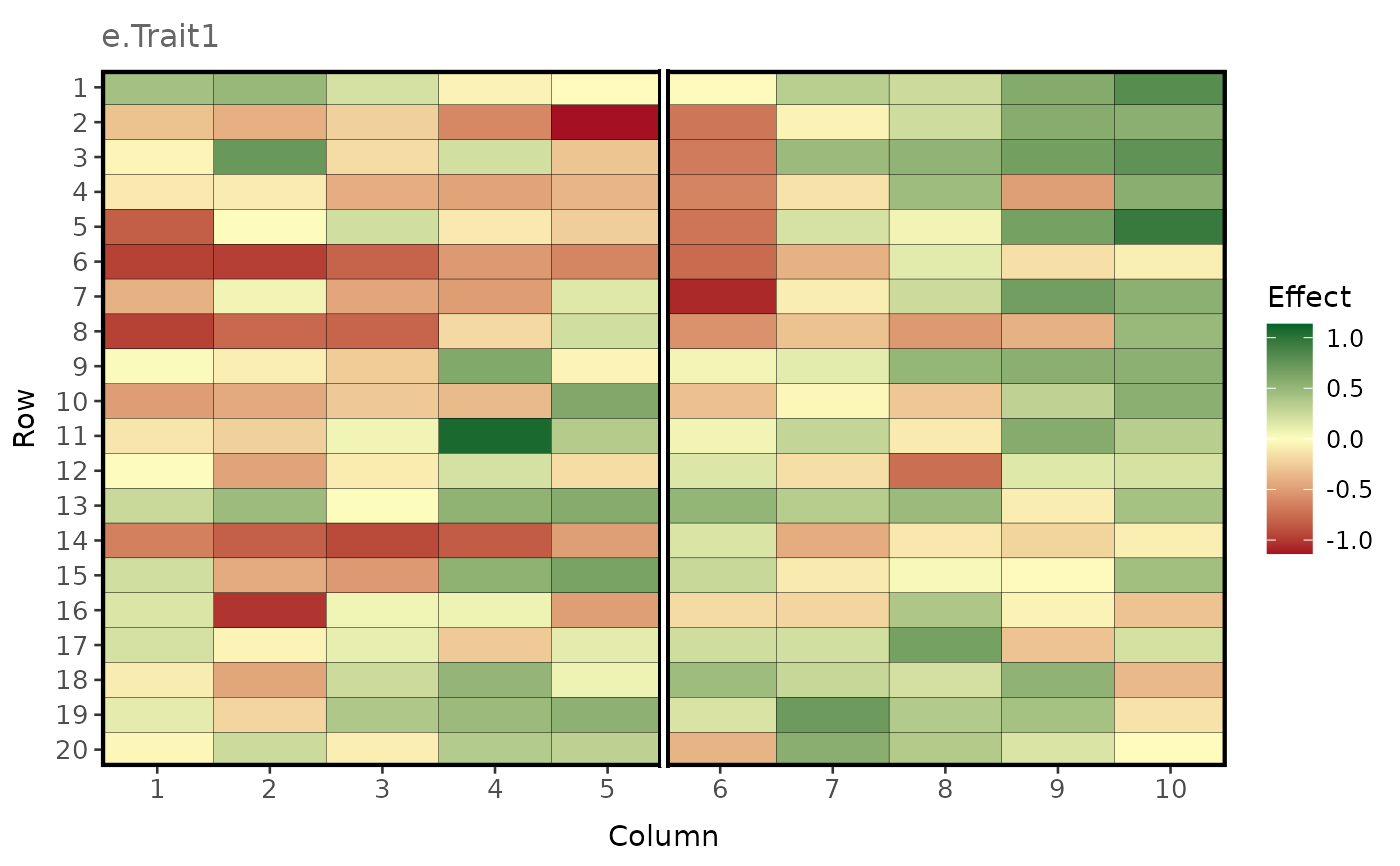
Creates a graphical field array for a set of plot effects (e.g., phenotypes, genetic values, or plot errors). Requires a data frame generated with the functions field_trial_error or make_phenotypes, or any data frame matching the description below.
Arguments
- df
A data frame with columns containing the column and row dimensions, and the effects to be plotted.
- effect
A character defining the effects to be plotted.
- blocks
When
TRUE(default), the field array is split into blocks. This requires an additional column in the data frame, as specified bydim.names.- labels
When
TRUE(default), column and row labels are displayed.- dim.names
An optional vector defining the column, row and block dimensions ('col', 'row' and 'block' by default).